
CEMP-E
TI 809-07
30 November 1998
capacity calculations. This table gives the column nominal areas, Ac, distance to the extreme fiber, c,
in-plane and out-of-plane moments of inertia and radius of gyration. The columns are conservatively
assumed to be pinned at their tops and bottom (limited moment resistance when the full axial load is
applied) so that the effective length factor, K is 1.0.
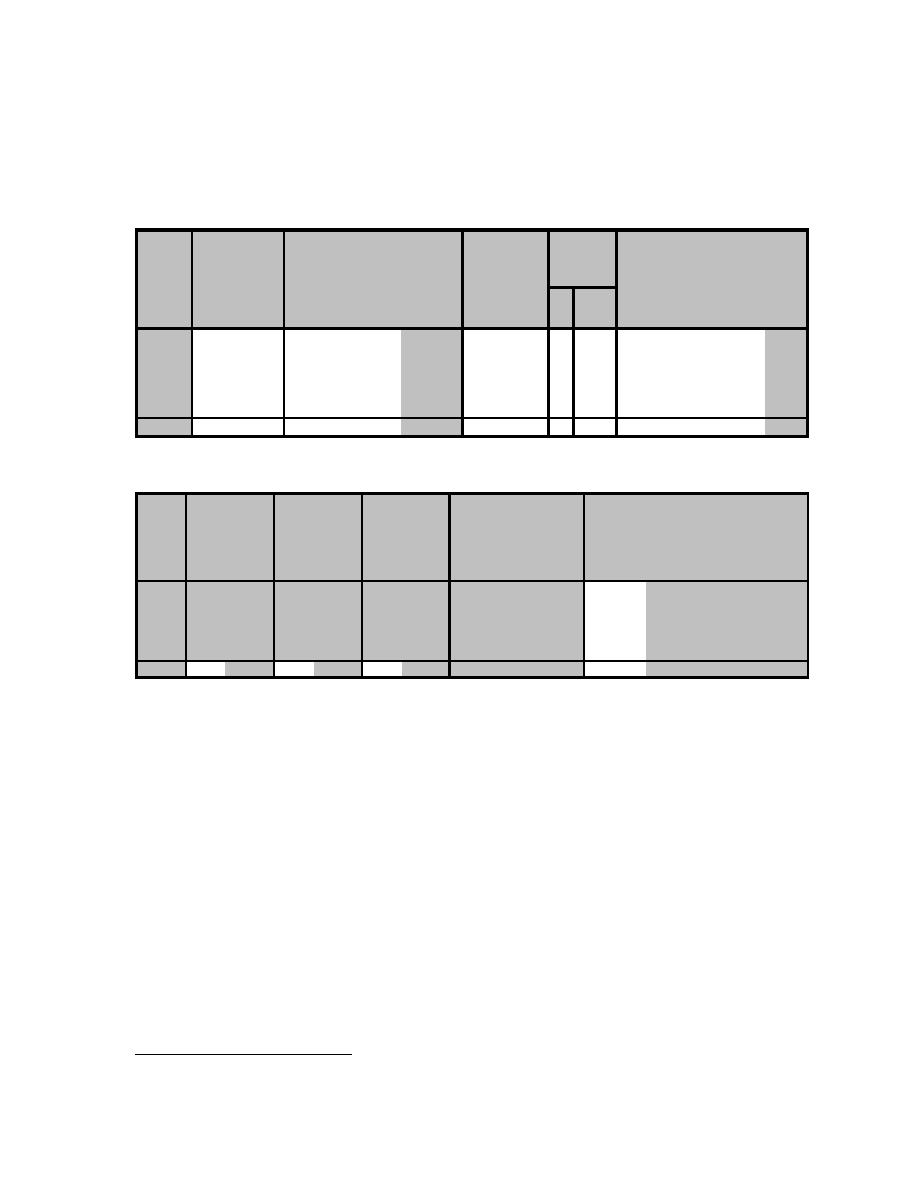
Table D-8. Column Design for Cold-Formed Steel Shear Panels Barracks Example.7
Diagonal Max Ult Number Max Gravity
Column
Column Column
Number
Panel
Col Stud
Strap Ult Strap
of Shear
Load/
Axial load
Yield Ultimate
Column of Studs Thickness Flange Column
Stress
Stress
Panels
Panel
at Strap Ult Stress Stress
Thickness /Column /Column
Width
Depth
GLmax
Pvumax
Fcy
Fcu
tc
bc
bf
hc
Fu
Fsumax
/Frame
n
(ksi)
(ksi)
(kips)
(k)
(ksi)
(ksi)
(ga)
(in)
(in)
(in)
(in)
3rd Floor
45
68
2
2.66
13.6
33
45
16 0.0598
2
6.0
2.0
4.0
3rd Floor*
45
68
2
2.66
17.1
33
45
14 0.0747
2
6.0
2.0
4.0
2nd Floor
45
68
2
14.48
45.3
50
65
14 0.0747
3
6.0
2.0
6.0
1st Floor
45
68
2
28.38
66.4
50
65
12 0.1046
3
6.0
2.0
6.0
1st Floor*
45
68
2
28.38
63.9
50
65
12 0.1046
4
6.0
2.0
8.0
1st Floor
65
81
2
28.38
59.1
46
58
0.1875
1
6.0
6.0
6.0
8
Table D-9. Column Capacity Calculations for Shear Panels Barracks Example.
Nominal Distance
In-Plane
Out-of-Plane
Eff
Elastic
Nominal Knockout
Eff
Column
Column to Extreme Mom of Radius of Mom of Radius of Length Flexural
Axial
hole
Flat Slenderness Eff Column Design
Area
Fiber
Inertia
Gyration
Inertia
Gyration Factor
Stress
Stress
dia
Width
factor
Width Area
Strength
λ
λ
Ac
Ix
ry
Iy
rx
Fe
Fn
dh
Ae
c
K
w
b
P
c
2
4
4
2
(in )
(in )
(in )
(in )
(in)
(in)
(in)
(ksi)
(ksi)
(in)
(in)
(kips)
3rd Floor
1.20
2.00
3.37
1.68
6.25
2.29
1
78
0.65 27.66
1.5
5.761
1.565
2.40 0.794
18.7
3rd Floor*
1.49
2.00
4.16
1.67
7.74
2.28
1
77
0.65 27.61
1.5
5.701
1.239
2.82 1.063
24.9
2nd Floor
2.24
3.21
10.72
2.19
11.61
2.28
1
106
0.69 41.06
1.5
5.701
1.511
2.43 1.508
52.6
1st Floor
3.14
3.21
14.80
2.17
15.99
2.26
1
113
0.67 41.52
1.5
5.582
1.062
3.04
2.34
82.6
1st Floor*
4.18
4.00
32.40
2.78
21.31
2.26
1
122
0.64 42.09
1.5
5.582
1.069
3.02 3.114
111.4
1st Floor
4.27
3.00
23.8
2.36
23.8
2.36
1
133
0.59 39.80
1.5
5.250
0.546
3.75 3.708
125.4
The last row in Table D-8 and D-9 is for a panel with columns made up of 6 x 6 x 3/16 inch structural
tubing members (Panel D configuration). The tubing material is ASTM A500 Grade B, with minimum
(design) yield stress, Fcy and minimum ultimate stress, Fcu values of 46 ksi and 58 ksi, respectively.
Similar to the column studs, it is assumed that 1.5 inch wide holes will be drilled through the faces of
the column that are out-of-plane to the shear panel. These holes are for conduit.
The elastic flexural stress, Fe shown in Table D-9 is calculated based on Equation C-39, and, λ is
c
calculated based on Equation C-38. The nominal axial stress, Fn is then calculated based on either
Equation C-36 or C-37, depending on the value of λ .
c
The effective areas, Ae, of the columns are calculated according to Equation C-41. Values of the
terms used to define this area are also given in Table D-9. Finally, the column design strength, P, is
calculated according to Equation C-35. Values of P are given in Table D-9 for each trial column.
Through an iterative process in the spreadsheet program, trial column configurations were defined
where P exceeds the column axial load at the maximum ultimate stress in the diagonal straps, Pvumax.
From these results the column configurations marked with an asterisk in Table D-8 and D-9 were
selected for the three floor levels9.
7
Asterisk designates selected columns.
8
Asterisk designates selected columns.
9
The second floor panel shown in these tables is not marked with an asterisk because the panel anchors are inadequate,
which may require an increase in column stud thickness, tc.
D-10

 Previous Page
