CEMP-E
TI 809-07
NOVEMBER 1998
interstory height over interstory displacement. The commentary to the SAC document explains that
the interstory drift angle of 0.005 radians corresponds to a conservative estimate of the value that
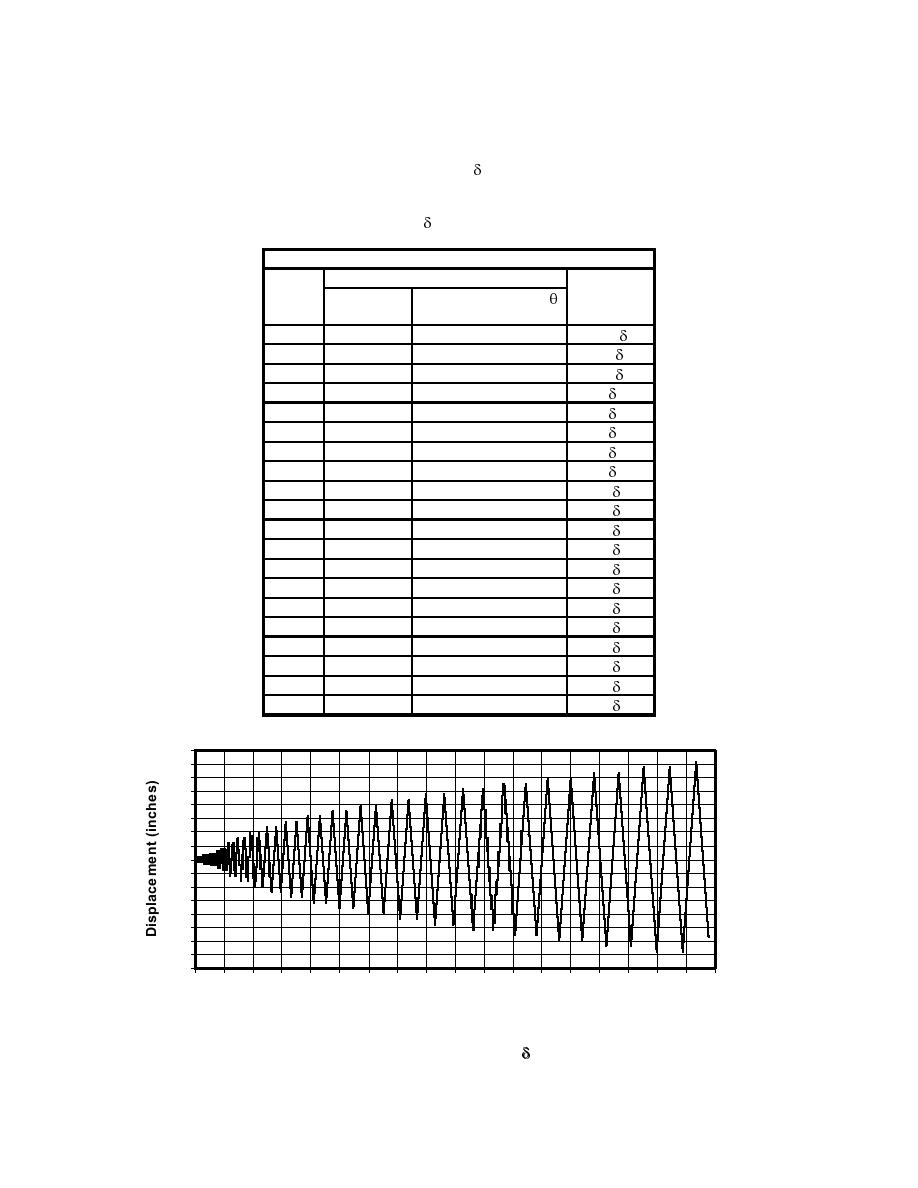
would cause yield deformation. Therefore, the load protocol defined by SAC in terms of drift angle
are scaled to the measured lateral yield deflection, y to define the cyclic test steps as defined in
Table F-3. This protocol calls for a set number of cycles at each of the deformation amplitudes
shown in Table F-3. This protocol is illustrated by the deformation time history shown in Figure F-2,
which is based on a lateral yield deflection, y of 0.4 inches and stroke rate of 6 inches per minute.
Table F-3.Cyclic Test Load Protocol.
Load
SAC-2
Modified
Step # Number of Peak Deformation,
SAC
Amplitude
Cycles, n
(radians)
1
6
0.00375
0.75 y
2
6
0.005
1.0 y
3
6
0.0075
1.5 y
4
4
0.01
2 y
5
2
0.015
3 y
6
2
0.02
4 y
7
2
0.03
6 y
8
2
0.04
8 y
9
2
0.05
10 y
10
2
0.06
12 y
11
2
0.07
14 y
12
2
0.08
16 y
13
2
0.09
18 y
14
2
0.10
20 y
15
2
0.11
22 y
16
2
0.12
24 y
17
2
0.13
26 y
18
2
0.14
28 y
19
2
0.15
30 y
20
2
0.16
32 y
16
14
12
10
8
6
4
2
0
-2
-4
-6
-8
-10
-12
-14
-16
0
10 20 30 40 50 60 70 80 90 100 110 120 130 140 150 160 170 180
Time (minutes)
Figure F-2. Modified SAC cyclic test time history with
= 0.4 in and 6 in/min stroke rate.
y
F-4


 Previous Page
