UFC 3-210-10
25 October 2004
Pollutant load calculations were developed for this project using a
in which to locate water quality improvement features. Although this method is more
appropriate for larger watersheds and preliminary planning, the local jurisdiction uses it
to evaluate water quality loading. Equation 10-1 is the water quality calculation.
L = 0.226 R C A
Equation 10-1
Where: L = Annual load (lbs)
R = Annual runoff (inches)
C = Pollutant concentration (mg/l)
A = Area (acres)
0.226 = Unit conversion factor
(Schueler, 1987)
Equation 10-2 is the projected load reduction.
D = L (1 - E )
Equation 10-2
Where: D = Annual load reduction (lbs)
L = Annual load (lbs)
E = Pollutant removal efficiency (fraction)
For the purposes of this study, removal rates of 70 percent were used for
bioretention and tree box filters, and a removal rate of 50 percent was used for
permeable pavers. Calculations were performed for lead, copper, zinc, phosphorus and
total nitrogen. The results show an overall reduction of almost 65 percent of the
aggregate load for the areas directly controlled by the practices and 55 percent of the
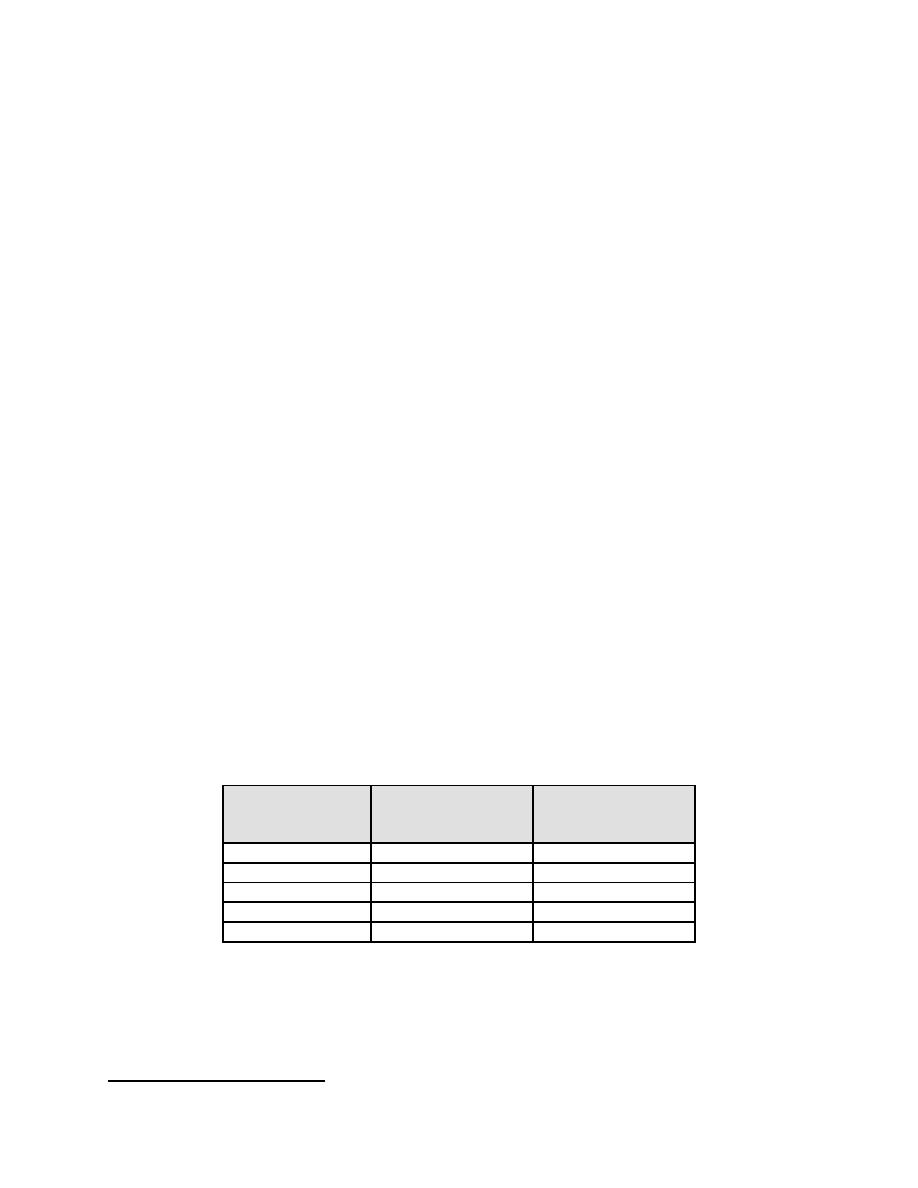
total annual load for the pollutants studied. Table 10-1 shows the projected load
reduction for various pollutants.
Table 10-1. Projected Load Reduction After LID Retrofit
Annual Load
Annual Load (lbs)
kg (lbs)
Pollutant
After LID Retrofit
Existing Condition
Zinc
7.94 (17.5)
2.8 (6.1)
Lead
7.76 (17.1)
2.7 (6.0)
Copper
2.1 (4.6)
0.73 (1.6)
Nitrogen (TKN)
43.4 (95.6)
15.1 (33.2)
Phosphorus
20.2 (44.5)
7.03 (15.5)
10-2
NEW HOUSING DESIGN. This example will demonstrate the differences
between conventional and LID stormwater management approaches for a typical DoD
housing community in a coastal area. The design objectives are to maintain the peak
runoff rate for a Type II NRCS 2-year 24-hour storm event and provide water quality
control for the development. Following the hydrologic analysis presented here, a series
38
Schueler, 1987.
66


 Previous Page
