*TM 5-813-1/AFM-88-10, Vol. 1
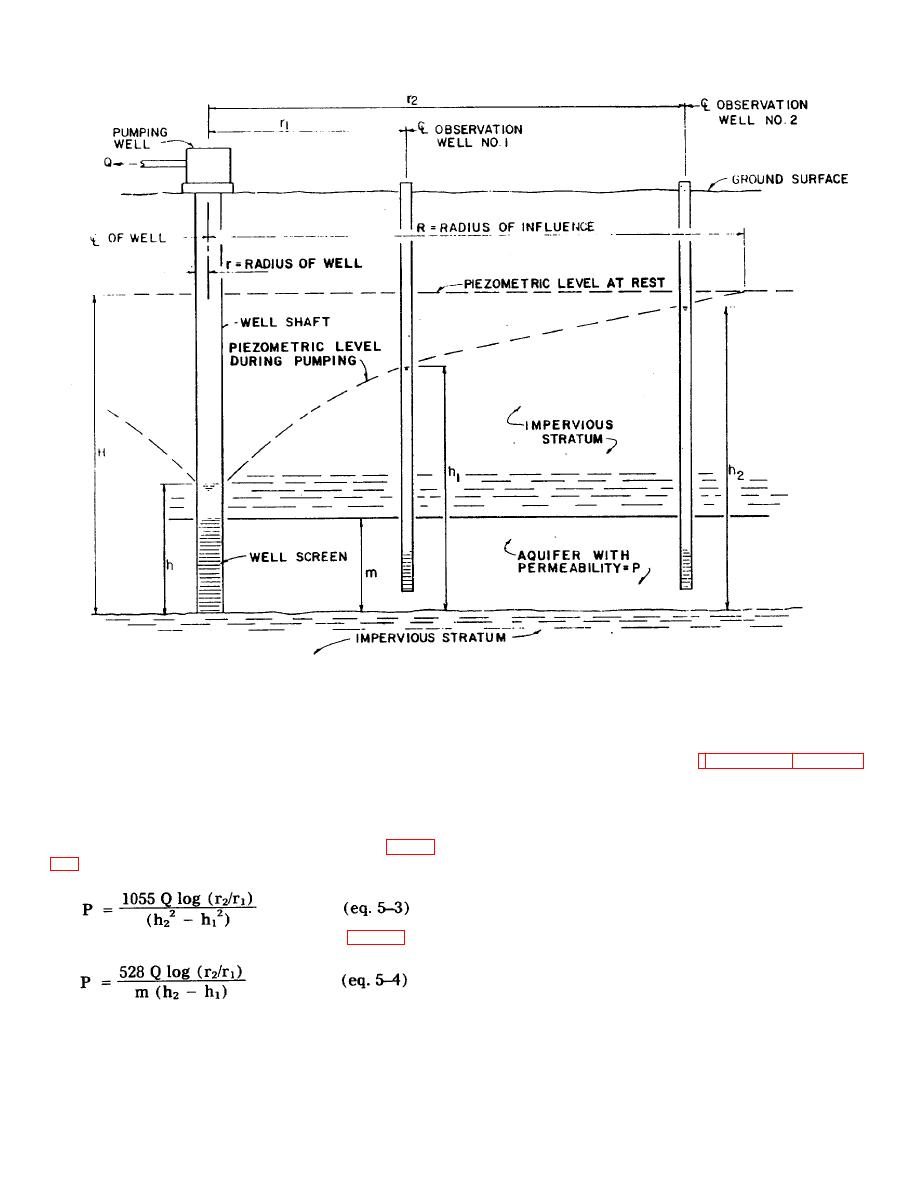
Figure 5-5. Diagram of well in artesian aquifer.
c.
Determination of values. The well driller's
values used for design. Testing consists of pumping
from one well and noting the change in watertable at
log provides the dimensions of H and h. The value of R
other wells as indicated in figures 5-4 and 5-5.
usually lies between 100 and 10,000.
It may be
Observation wells are generally set at 50 to 500 feet from
determined from observation wells or estimated. A value
a pumped well, although for artesian aquifers they may
of R = 1000 may be used; large variations makes small
be placed at distances up to 1000 feet. A greater
difference in the flow. P may be determined from
number of wells allows the slope of the drawdown curve
laboratory tests or field tests. Existing wells or test wells
to be more accurately determined. The three most
may provide the values for all of these equations. Figure
common methods of testing are:
-Drawdown Method. Involves pumping one well
formula for calculating P:
and observing what happens in observation wells.
-Recovery Method. Involves shutting down of a
pumped well and noting recovery of water level in
For artesian conditions, again, as shown in fig. 5-5, the
observation wells.
formula becomes:
-Water Input Test. Involves running water into a
well and determining the rate at which water flows into
the aquifer.
d.
Aquifer testing. Where existing wells or
The typical test, utilizing the drawdown method, consists
other data are insufficient to determine aquifer
of pumping a well at various rates and noting the
characteristics, testing may be necessary to establish
corresponding drawdown at each step.
5-8


 Previous Page
