TM 5-818-5/AFM 88-5, Chap 6/NAVFAC P-418
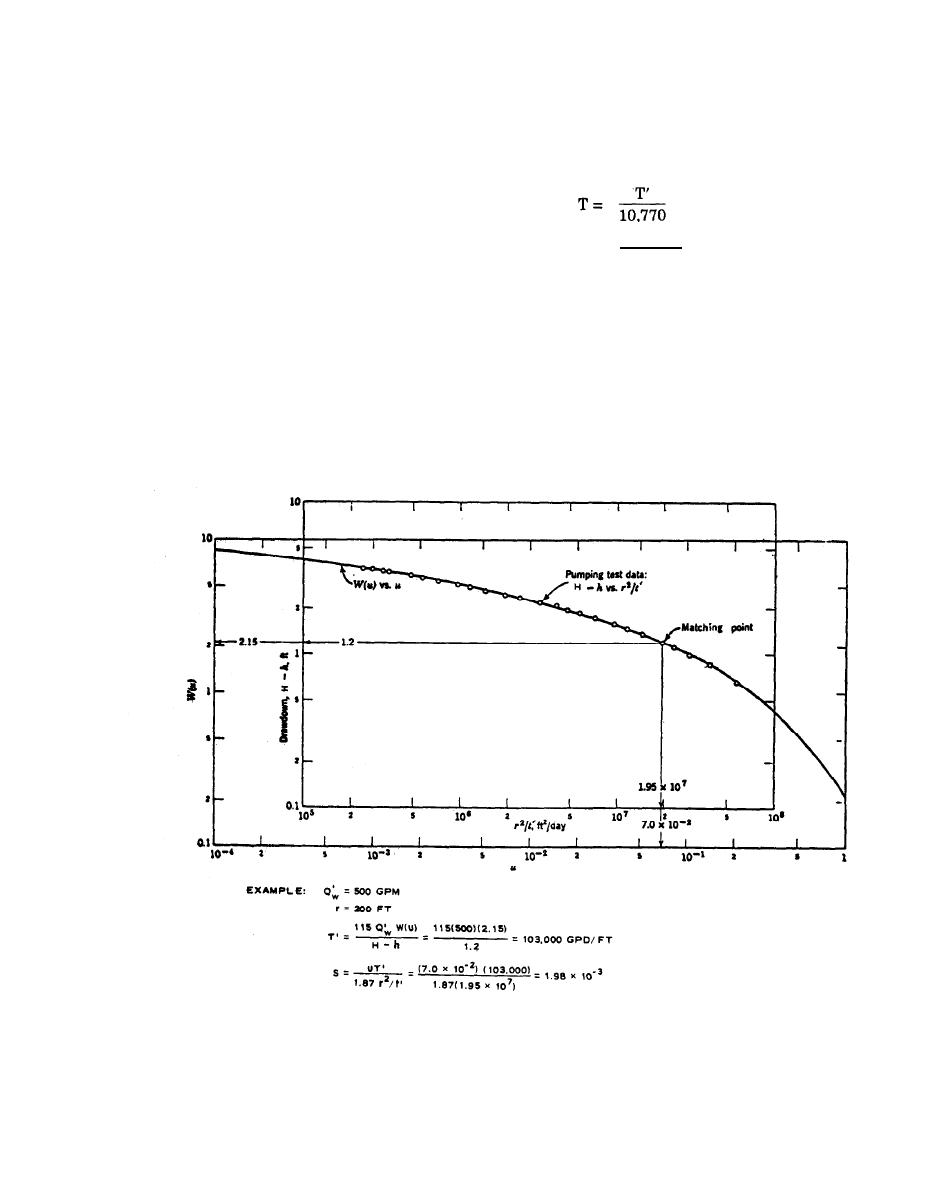
segment, and record coordinates of matching point
where
r = distance from test well to observation
(fig. C-8).
piezometer, feet
Step 5. With value of W(u), u, H-h, and r2/t'
S = coefficient of storage
thus determined, compute S and T' from equations
t' = elapsed pumping time in days
(C-3) and (C-4).
The formation constants can be obtained approximate-
Step 6. T and k from the following equations:
ly from the pumping test data using a graphical meth-
(square feet per minute)
(C-5)
od of superposition, which is outlined below.
Step 1. Plot W(u) versus u on log graph paper,
T'
known as a "type-curve," using table C-1 as in figure
k=
(feet per minute)
(C-6)
10,770D
C-8.
Step 2. Plot drawdown (H-h) versus r2/t' on log
(2) Method 2. This method can be used as an ap-
proximate solution for nonequilibrium flow to a well to
graph paper of same size as the type-curve in figure
avoid the curve-fitting techniques of method 1 by
C-8.
Step 3. Superimpose observed data curve on
using the techniques outlined below,
Step 1. Plot time versus drawdown on semilog
type-curve, keeping coordinates axes of the two curves
graph as in figure C-9.
parallel, and adjust until a position is found by trial
Step 2. Choose an arbitrary point on time-draw-
whereby most of the plotted data fall on a segment of
down curve, and note coordinates t and H-h.
the type-curve as in figure C-8.
Step 3. Draw a tangent to the time-drawdown
Step 4. Select an arbitrary point on coincident
(From "Ground Water Hydrology "by D. K. Todd, 1959, Wiley & Sons, Inc.
Used with permission of Wiley & Sons, Inc.)
Figure C-8. Method 1 (Superposition) for solution of the nonequilibrium equation.
C-9


 Previous Page
