TM 5-818-5/AFM 88-5, Chap 6/NAVFAC P-418
where
Step 2. Compute S from equation (C-4) for vari-
ous elapsed pumping times during the test period, and
drawdown in feet per cycle of (log) time-
As=
plot S versus (log) t'.
drawdown curve
to = time at zero drawdown in days
Step 3. Extrapolate the S versus (log) t' curve to
An example of the use of this method of analysis in de-
an ultimate value for S'.
termining values of T, S, and k is given in figure C-6,
Step 4. Compute u from equation (C-4), using
the extrapolated S', the originally computed T', and
using the nonequilibrium portion of the time-draw-
the original value of r2/t'.
down curve.
(4) Gravity flow. Although the equations for non-
Step 5. Recompute T' from equation (C-3) using
equilibrium pumping tests are derived for artesian
a W(u) corresponding to the computed value of u.
flow; they may be applied to gravity flow if the draw-
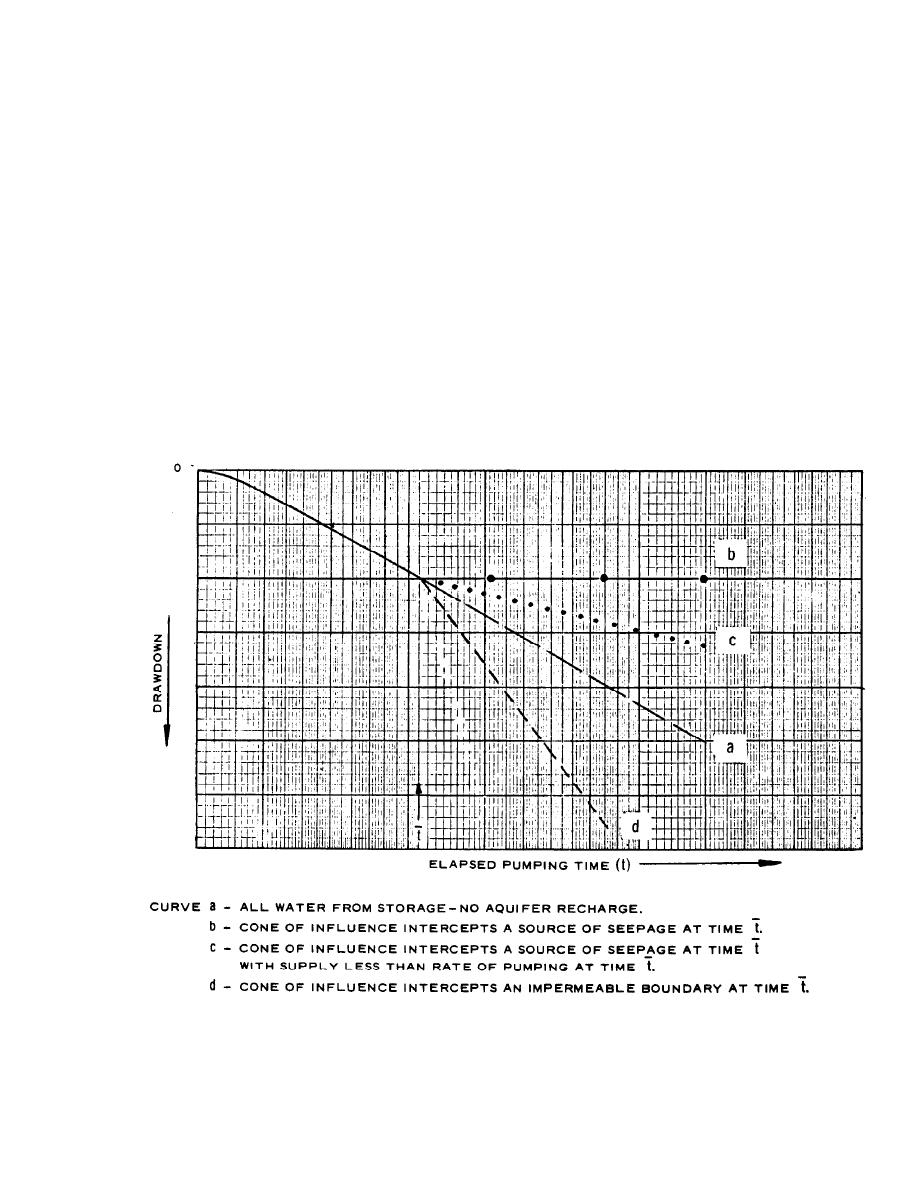
(5) Recharge: Time-drawdown curves of a test
down is small with respect to the saturated thickness
well are significantly affected by recharge or depletion
of the aquifer and is equal to the specific yield of the
of the aquifer, as shown in figure C-11. Where re-
dewatered portion of the aquifer plus the yield caused
charge does not occur, and all water is pumped from
by compression of the saturated portion of the aquifer
storage, the H' versus (log) t curve would resemble
as a result of lowering the groundwater. The procedure
curve a. Where the zone of influence intercepts a
for computing T' and S for nonequilibrium gravity
source of seepage, the H' versus (log) t curve would re-
semble curve b. There may be geological and recharge
flow conditions is outlined below.
Step 1. Compute T' from equation (C-3).
conditions where there is some recharge but not
U.S. Army Corps of Engineers
Figure C-11. Time-drawdown curves for various conditions of recharge.
C-11


 Previous Page
