TM 5-818-5/AFM 88-5, Chap 6/NAVFAC P-418
crustations in the wells or filters and, with time, cause
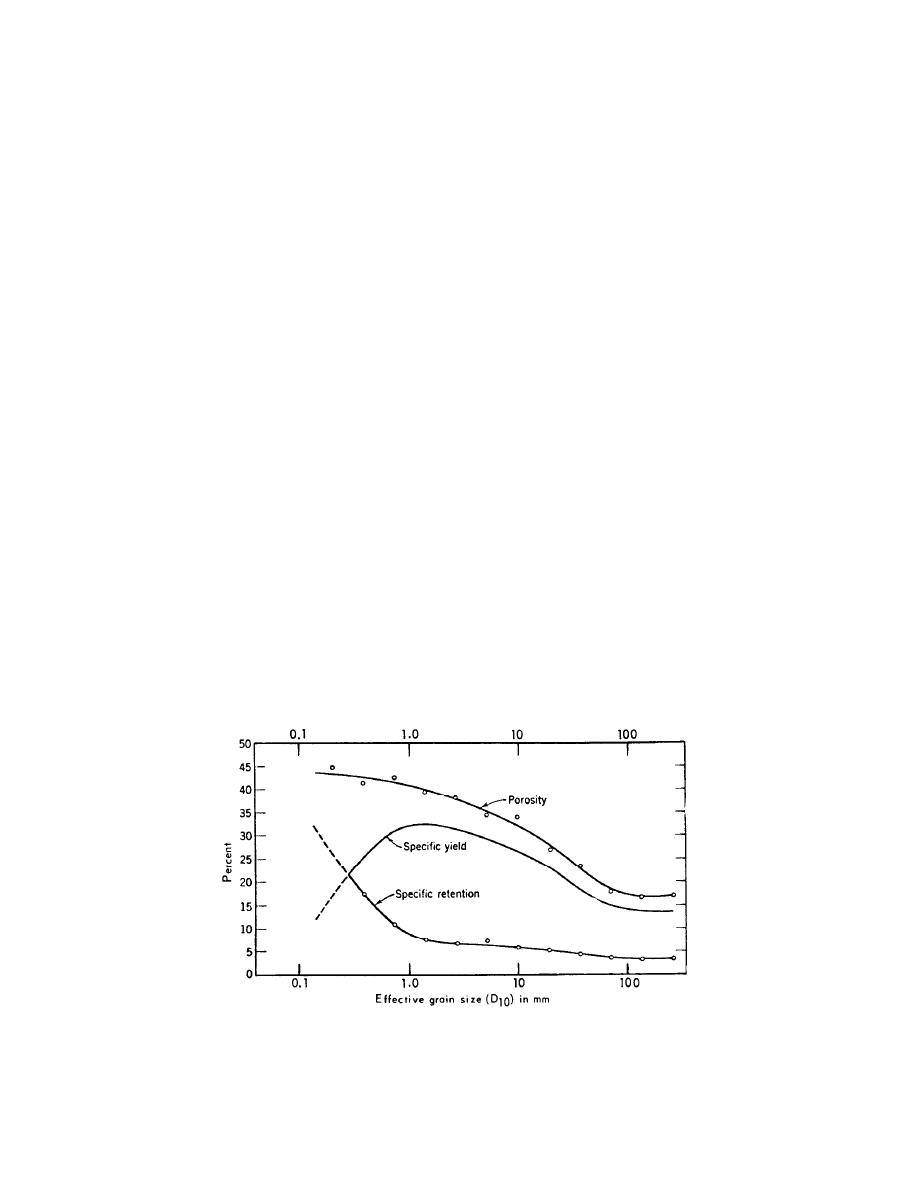
(or D10) and the relation given in figure 3-3 or table
clogging and -reduced efficiency of the dewatering or
3-2.
drainage system. Indicators of corrosive and incrust-
3-3. Groundwater characteristics.
ing waters are given in table 3-3. (Standard methods
for determining the chemical compositions of ground-
a. An investigation of groundwater at a site should
water are available from the American Public Health
include a study of the source of groundwater that
Association, Washington, DC
would flow to the dewatering or drainage system (para
2-2) and determination of the elevation of the water
d. Changes in the temperature of the groundwater
table and its variation with changes in river or tide
will result in minor variations of the quantity of water
stages, seasonal effects, and pumping from nearby wa-
flowing to a dewatering system. The change in viscosi-
ter wells. Groundwater and artesian pressure levels at
ty associated with temperature changes will result in a
a construction site are best determined from piezom-
change in flow of about 1.5 percent for each 1
eters installed in the stratum that may require dewa-
Fahrenheit of temperature change in the water. Only
tering. Piezometers in pervious soils may be commer-
large variations in temperature need be considered in
cial wellpoints, installed with or without a filter (para
design because the accuracy of determining other
4-6c) as the gradation of foundation material requires.
parameters does not warrant excessive refinement.
Piezometers in fine-grained soils with a low perme-
3-4. Permeability of pervious strata. The
ability, such as silt, generally consist of porous plastic
rate at which water can be pumped from a dewatering
or ceramic tips installed within a filter and attached to
system is directly proportional to the coefficient of
a relatively small diameter riser pipe.
permeability of the formation being dewatered; thus,
this parameter should be determined reasonably accu-
an extended period of time to establish variations in
rately prior to the design of any drainage system.
level likely to occur during the construction or opera-
Methods that can be used to estimate or determine the
tion of a project. General information regarding the
permeability of a pervious aquifer are presented in the
groundwater table and river or tide stages in the area
following paragraphs.
is often available from public agencies and may serve
a. Visual classification. The simplest approximate
as a basis of establishing general water levels. Specific
method for estimating the permeability of sand is by
conditions at a site can then be predicted by correlat-
visual examination and classification, and comparison
ing the long-term recorded observations in the area
with sands of known permeability. An approximation
with more detailed short-term observations at the site.
of the permeability of clean sands can be obtained
from table 3-4.
of concern, because some groundwaters are highly cor-
rosive to metal screens, pipes, and pumps, or may con-
b. Empirical relation between D10 and k. The per-
tain dissolved metals or carbonates that will form in-
meability of a clean sand can be estimated from em-
(From "Ground Water Hydrology" by D. K. Todd, 1959, Wiley & Sons,
Inc. Used with permission of Wiley & Sons, Inc.)
Figure 3-3. Specific yield of water-bearing sands versus D10, South Coastal Basin, California.
3-4


 Previous Page
