TM 5-820-1/AFM 88-5, Chap 1
APPENDIX B
DESIGN PROCEDURE
B-1. Rainfall.
the 2-year l-hour rainfall can be estimated from the following parameters: mean annual precipitation--
the average of total yearly rainfall for a specified number of years; mean annual number of days of
precipitationthe average number of days for a specified number of years in which greater than 0.01
inch of rain occurred; mean annual thunderstorm days--the average number of days for a specified
number of years in which thunder was heard; and the mean of the annual maximum observational-day
rainfall amounts--the average of the maximum rainfall on any calendar day within the year for a
specified number of years. Correlation of the 2-year 1-hour rainfall with these four climatic parameters
appears in figure B1.
(1) When daily rainfall data are not available, the 2-year l-hour value can be estimated using the
other three parameters, namely, mean annual precipitation, mean annual number of precipitation days,
and mean annual number of thunderstorm days. Three parameters are not as accurate as four, and the
diagram should be supplemented wherever possible by correlation with other data.
(2) As an example of the use of figure B-1, assume the mean annual precipitation is 60 inches, the
mean annual number of thunderstorm days is 50, and the mean annual number of precipitation days is
200. Enter the diagram at the upper right with the mean annual precipitation; proceed vertically down to
the mean annual number of thunderstorm days; move horizontally to the left to the number of days of
precipitation, and then vertically downward to the 2-year l-hour precipitation value (first estimate). In
this example, the first estimate for the 2-year l-hour precipitation is approximately 1.4 inches. Now
assume the fourth parameter, the mean of annual series of maximum daily precipitation, is 4.3 inches.
The same procedure is followed to the mean annual days of precipitation; from there, move vertically
upward to the mean of annual series of maximum daily precipitation value and then horizontally to the
right to the 2-year l-hour precipitation value (second estimate). In this example, the second estimate
would be 2.0 inches. The second estimate is preferable, if four parameters are available.
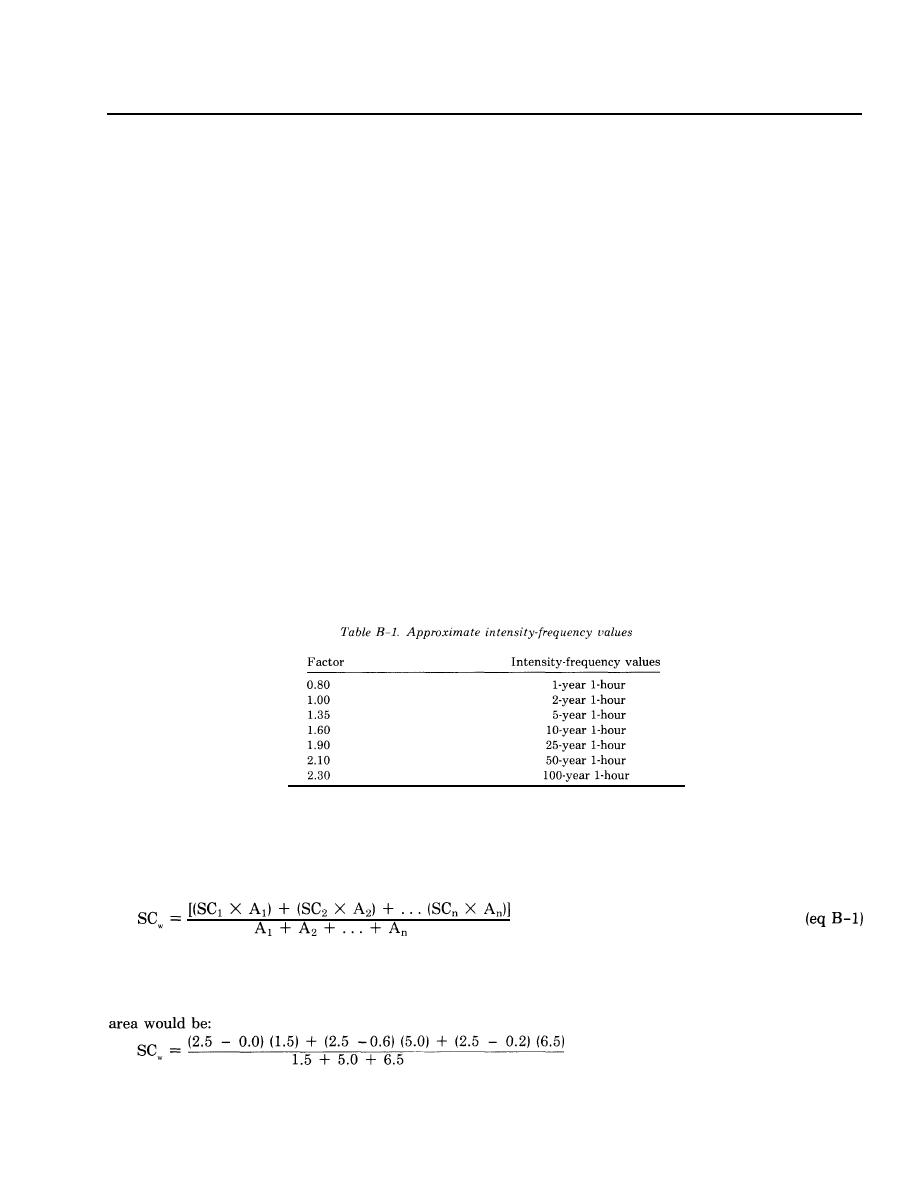
(3) For frequencies other than 2 years, the following factors in table B-1 can be used to
approximate intensity-frequency values, using the 2-year 1-hour value as a base:
b. Standard rate of supply curves. Standard supply curves for areas with zero infiltration loss will be
the same as the standard rainfall intensity curves in figure 2 (see main text). Where infiltration losses
occur, the standard supply curve number corresponding to a given standard rainfall curve number is
computed by subtracting the estimated l-hour infiltration value from the 1-hour rainfall quantity.
c. Weighted standard rates of supply. For composite areas, the rate of supply should be the average
weighted supply. Mathematically, the weighted supply curve, SCW, can be expressed by the equation:
where the SC's are standard supply rates for the various areas, A. For example, if the drainage area
under consideration has a 1-hour rainfall intensity of 2.5 inches; estimated infiltration values of 0.0 for
paved area Al, 0.6 for turfed area AZ, and 0.2 for bare clay area A3; and drainage area Al is 1.5 acres,
A2 is 5.0 acres, and A3 is 6.5 acres; then the weighted standard supply curve for the composite drainage
B-1


 Previous Page
