TM 5-818-4/AFM 88-5, Chap. 5
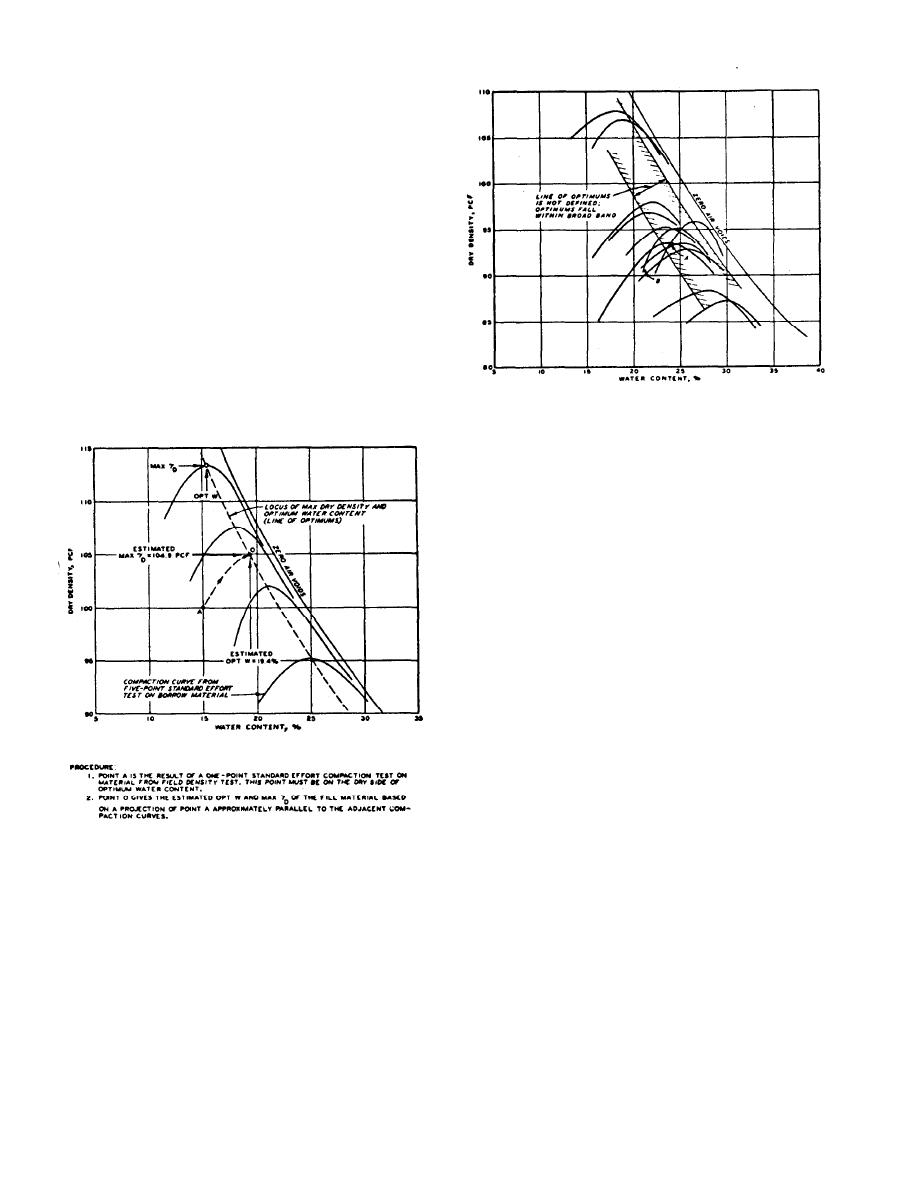
well defined in the figure, and the compaction curves
are approximately parallel to each other; consequent-
ly, the one-point compaction method could be used
with a relatively high degree of confidence. In figure
B-5, however, the optimums do not define a line, but a
broad band. Also, the compaction curves are not paral-
lel to each other and in several instances cross on the
dry side. To illustrate the error that could result from
using the one-point method, consider the field density
and water content shown by point B in figure B-5.
Point B is close to three compaction curves. Conse-
quently, the correct curve cannot be determined from
the one point. The estimated maximum dry density
and optimum water content could vary from about
92.8 pounds per cubic foot and 26 percent, respective-
ly, to 95.0 pounds per cubic foot and 24 percent, re-
spectively, depending on which curve was used. There-
fore, the one-point method should be used only when
the basic compaction curves define a relatively good
Figure B-5. Illustration of possible error using one- and two-point
line of optimums.
compaction methods.
(para B-8a), and dry densities are computed. The re-
sults are used to identify the appropriate compaction
curve for the material test (fig. B-6). The data shown
in figure B-6 warrant the use of the two-point compac-
tion test since the five-point compaction curves are not
parallel. Using point A only as in the one-point test
method would result in appreciable error as the shape
of the curve would not be defined. The estimated com-
paction curve can be more accurately defined by two
compaction points as shown. Although the two-point
method is more accurate than the one-point method,
neither method would have acceptable accuracy when
applied to the set of compaction curves shown in
figure B-5.
(3) Rapid one-point test for sands. A rapid check
test for compaction of uniform sands (SP to SM) with
less than 10 percent fines (minus No. 200 sieve) is a
modified one-point test. The ovendry sand is com-
pacted in a 4-inch-diameter mold using CE 55 (modi-
fied) effort. Correlation with standard compaction
tests is required to confirm the validity of test results
Figure B-4. Illustration of one-point compaction method.
for different sands used on each project.
(2) Two-point compaction test results. In the two-
(4) USBR rapid compaction control method. De-
point test, one sample of material from the location of
tails of this method are described in the USBR Earth
the field density test is compacted at the fill water con-
Manual (app A), The test is applicable to fine-grained
tent if thought to be at or on the dry side of optimum
(100 percent minus No. 4 sieve) cohesive soils with li-
water content (otherwise, reduced by drying to this
quid limits less than 50. The method, however, is ap-
condition) using the same equipment and procedures
plicable to soils containing oversize particles providing
used in the five-point compaction test. A second sam-
the proper corrections, as stated in EM 1110-2-1911,
ple of material is allowed to dry back about 2 to 3 per-
Appendix B, are applied. It is a faster method than the
centage points dry of the water content of the first
standard compaction test and is often more accurate
sample, and then compacted in the same manner. Af-
than other methods. The method usually requires add-
ter compaction, water contents of the two samples are
ing water to or drying back sampled fill material, and
determined by ovendrying or other more rapid means
thorough mixing is needed to obtain uniform drying or
B-6


 Previous Page
