TM 5-818-1 / AFM 88-3, Chap. 7
requires care and judgment. Sometimes it is better to
of the versus log p curve is the compression ratio, CR,
estimate two positions of this point-one as small as likely,
defined as
and the other as large as plausible, consistent with the
∆ε
data-and to repeat the construction for both cases. The
(3-4)
CR =
=
Cc
result will be a range of preconsolidation stresses.
log p2'
1 + e0
Because the determination of pc involves some
p1'
inevitable inaccuracy, the range of possible values may
be more useful than a single estimate which falls
where & is the change in vertical strain corresponding to
somewhere in the possible range. The higher the quality
a change in effective stress from p1' to p2', and e0 is the
of the test specimen, the smaller is the range of possible
initial (or in situ) void ratio. An approximate correlation
pc values. Approximate values of preconsolidation
between CR and natural water content in clays is given
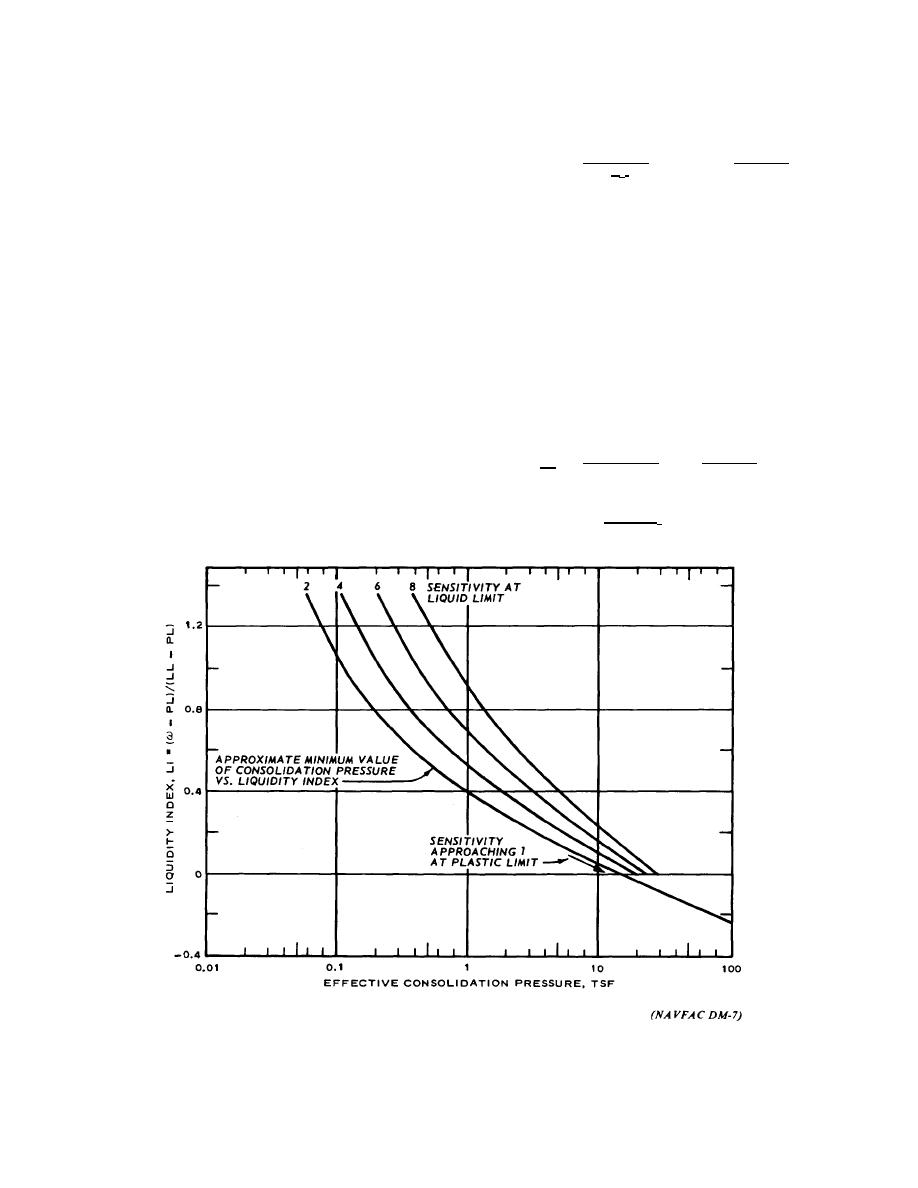
pressure may be estimated from figure 3-8 or 3-9. Table
by the following:
3-2 can be used to obtain gross estimates of site
preconsolidation. This table and figures 3-8 and 3-9
CR = 0.006 (w - 12)(3-5)
should be applied before consolidation tests are
performed to assure test loads sufficiently high to define
d. Coefficient of volume compressibility. The
the virgin compression portion of e-log p plots.
relationship between deformation (or strain) and stress
for one-dimensional compression is expressed by the
c. Compression index. The slope of the virgin
coefficient of volume compressibility, m , which is
compression curve is the compression index Cc, defined
defined as
in figure 3-6.
Compression index correlations for
∆ε
∆ε
approximations are given in table 3-3. When volume
mv =
=
av
(3-6)
change is expressed as vertical strain instead of change
∆p
∆p (1 + e0)
1 + e0
in void ratio, the slope of the virgin compression part
mv =
0.434 Cc
(1 + e0)p'
Figure 3-8. Approximate relation between liquidity index and effective overburden pressure, as a function of the sensitivity
of the soil
3-9


 Previous Page
