TM 5-803-13/AFM 126-8
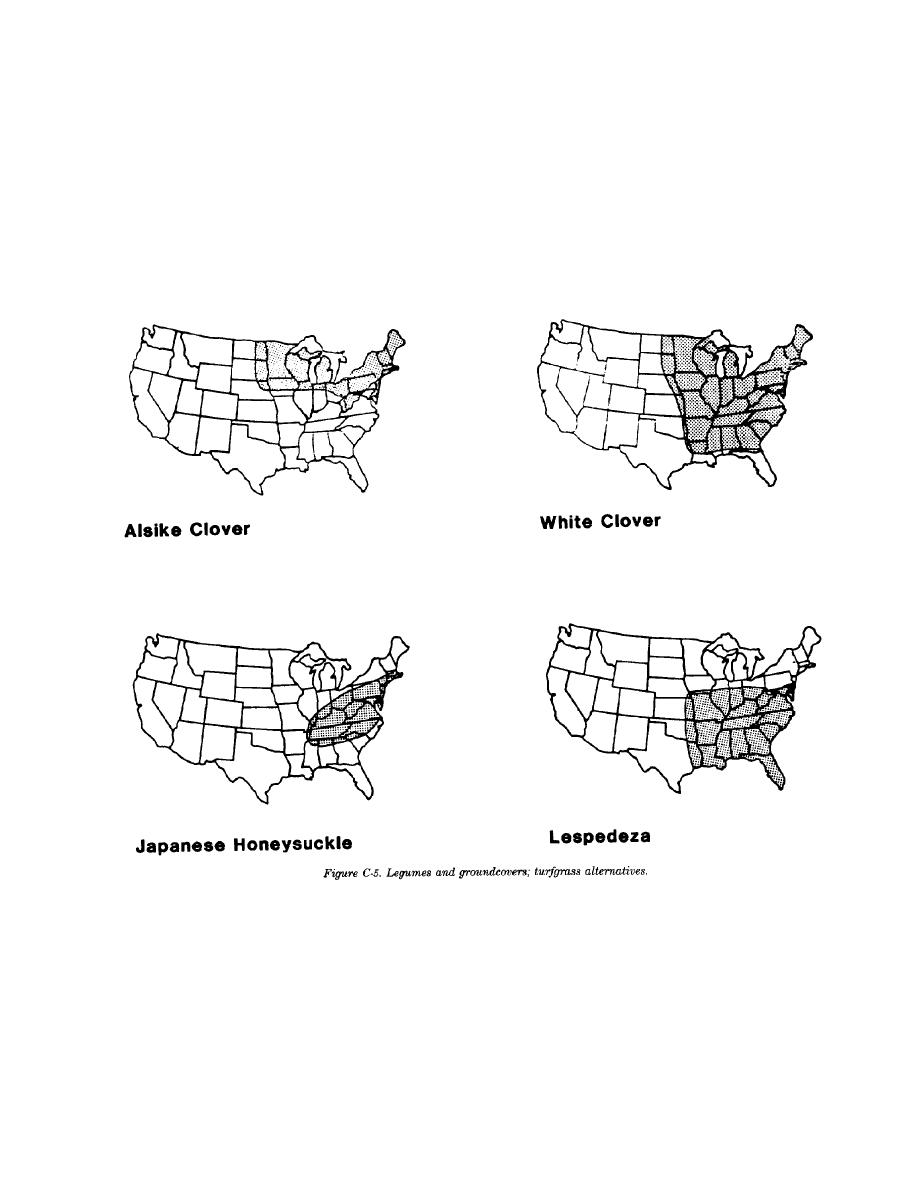
C-4. Figure C-5 illustrates the regional
C-1. For single, unmixed species, the data presented are
adaptation of some commonly used turf-grass
normally adequate without further computation. For
alternatives.
mixtures of two or more seed kinds, compute as shown in
the example in table C-2 for a 50-50 mixture of Kentucky
C-5. Computing percent purity. The percentage of
bluegrass and chewings Fescue:
pure live seed for most seed varieties is shown in table
C-7


 Previous Page
