TM 5-852-4/AFM 88-19, Chap. 4
U. S. Army Corps of Engineers
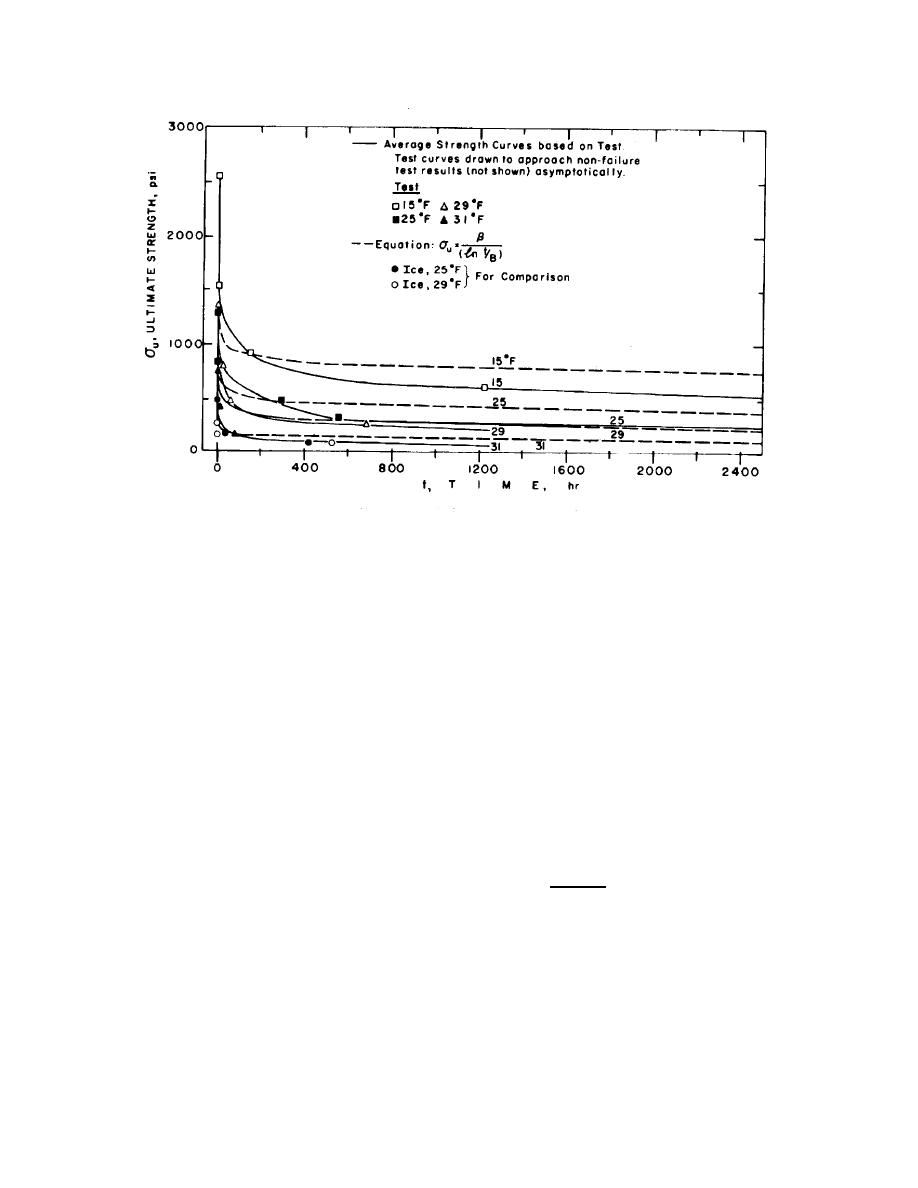
Figure 4-50. Ultimate strength vs. time to failure for Ottawa sand (20-30 mesh) at various temperatures, comparing test
data with computed values87.
and clays indicate that the long-term strength level can
are noticeably curved, that is, shear strength is not
be as low as 5 to 10 percent of that determined from a
directly proportional to normal stress. Therefore, when
standard test for compressive strength.
testing frozen soil for shear strength, the tests must be
d. The load carrying capacity of frozen soil is
performed using a normal stress near the value to which
the in-situ material will be subjected and large
essentially determined by its shear strength and within
extrapolations of the shear envelopes should be avoided.
certain limits the relationship between shear strength and
It is permissible and conservative to use a secant to the
normal pressure may be written as:
s = c + p tan φ
envelope if a straight line relationship between the shear
(Equation 2)
and normal stress is desired, provided the secant
where
c = cohesion, which is dependent upon
intersects the envelope at the in-situ stress value.
both temperature and time
φ = angle of internal friction
f.
Experimental work indicates that long-term
shear strength of saturated frozen soils can be
p = total normal stress.
determined for practical purposes by the equation:
e. To show graphically how shear strength varies with
time, Mohr's envelopes for frozen sand are shown in
σ
β
=
(by Vialov)
(Equation 3)
figure 4-51. The envelopes are plots of the ultimate
t
1n(t/B)
shear strength vs. normal stress for different rates of
applied strain in controlled strain rate type triaxial tests.
where σt
=
the constant stress level at which
Two characteristics are of interest here. First, the
failure will occur at time t in psi
ultimate shear strength is less for the low strain rates
than for the higher ones; and secondly, the envelopes
4-75


 Previous Page
