TM 5-852-4/AFM 88-19, Chap. 4
U. S. Army Corps of Engineers
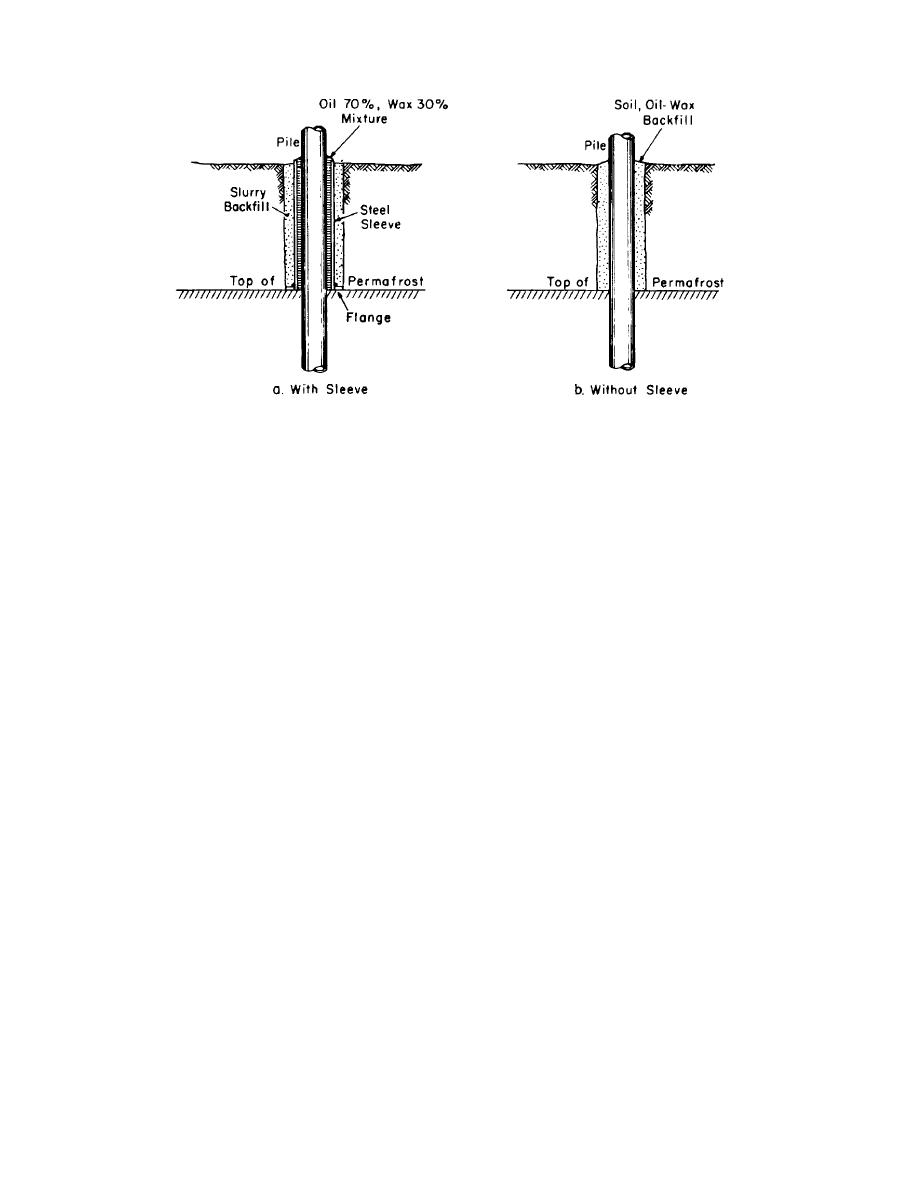
Figure 4-46. Heave isolation (by CRREL).
noted that for a given reduction of temperature, the
the annual frost zone, timber piles placed in this manner
increase in long-term strength is smaller in magnitude
have a preferred batter to further reduce frost thrust
than the increase in short-term strength; however, the
together with improved anchorage.
proportionate increases are comparable, as shown in
4-4. Allowable design stresses on basis of ultimate
figure 4-48.
strength.
Ultimate strength and deformation
b. The decrease in strength with increase in
characteristics of any particular saturated frozen soil
time over which a constant stress must be resisted is
depend primarily upon its temperature relative to 32
further illustrated in the unconfined compression test
and the period of time that the soil will be subjected to a
results shown in figures 4-49 and 4-50 for frozen
given stress. The ultimate strength increases as the
saturated Ottawa sand. The family of experimental
temperature decreases.
curves in figure 4-49 show creep curves for different
a. There are two primary reasons for the
applied constant stresses at 29F. Proceeding from high
increase in strength: first, the solidification by freezing of
to the lower stresses, the slopes of the curves decrease
an increasing proportion of the water in the voids as the
until the lower curve approaches a nearly horizontal
temperature drops (this is of importance primarily in fine-
straight line. The latter curve, which corresponds to the
grained soils, especially in the temperature range
between 32F and 0ƒF); and secondly, the increase in
maximum stress that the soil can resist indefinitely, is
considered the long-term strength of the soil.
strength of the ice fraction with decrease in temperature.
c. The plot of time to ultimate failure vs.
In addition, there is the possibility of a contribution
ultimate strength (fig. 4-50) indicates that for this
resulting from soil matrix consolidation due to ice
particular frozen soil the long-term strength at 25 F is in
segregation","'. The ultimate strength of frozen soil also
the order of about 20 percent of that determined from a
decreases with increase in the length of time over which
standard test for unconfined compressive strength.
a constant stress must be resisted. The dependence of
Tests on silts
ultimate strength of frozen soil on temperature and time-
duration of constant stress application is shown in a plot
of unconfined compressive strength vs. temperature for
87
a saturated frozen fine sand (fig. 4-47) . It should be
4-72


 Previous Page
