UFC 3-400-02
28 FEBRUARY 2003
Figure 2-8. Sample Data Set Page 8
WMO No. 724338
SCOTT AFB/BELLEVILLE
IL
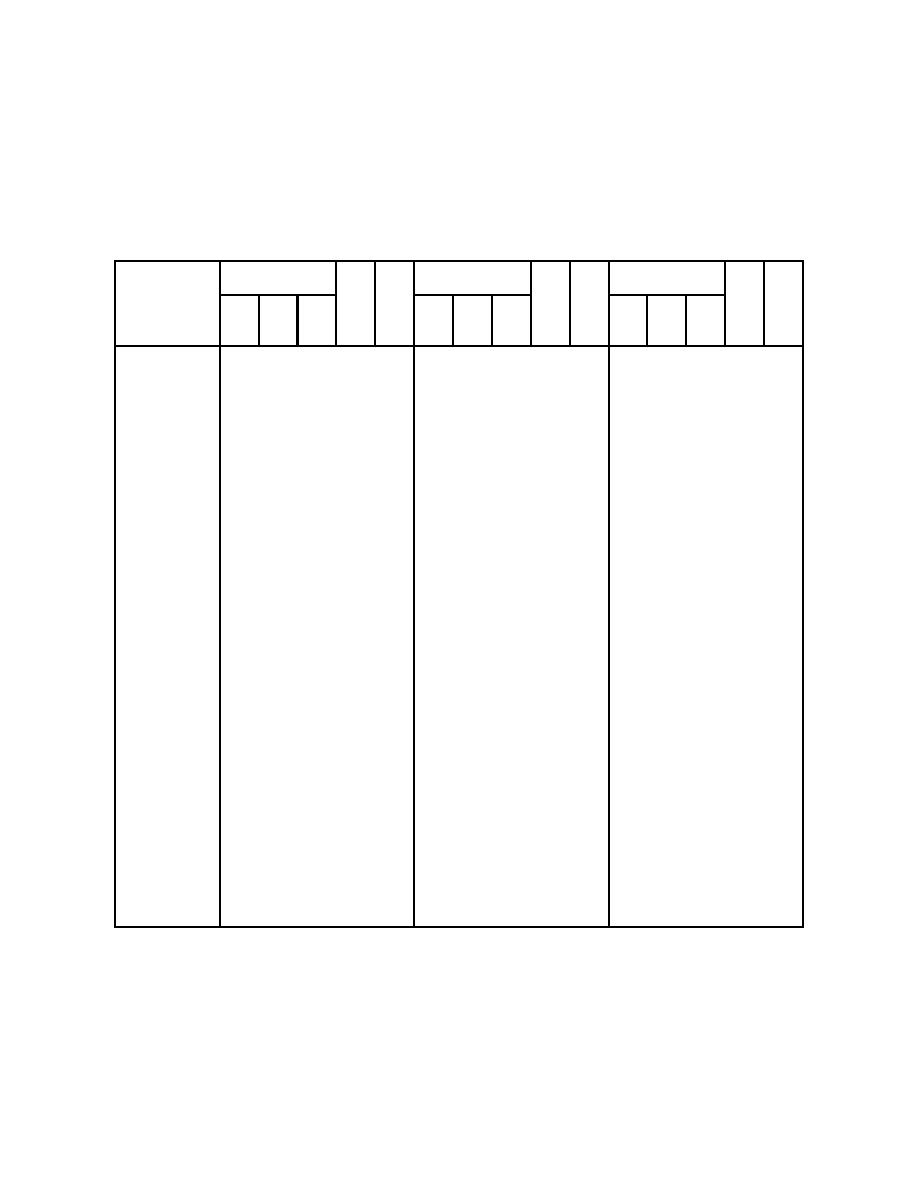
Dry-Bulb Temperature Hours For An Average Year (Sheet 4 of 5)
Period of Record = 1967 to 1996
October
November
December
Hour
M
Hour
M
Hour
M
Group (LST)
C
Group (LST)
C
Group (LST)
C
Temperature
01
09
17
W
01
09
17
W
01
09
17
W
Range
To
To
To
Total
B
To
To
To
Total
B
To
To
To
Total
B
(oF)
o
o
o
08
16
00
Obs
( F)
08
16
00
Obs
( F)
08
16
00
Obs
( F)
100 / 104
95 / 99
0
0
69.4
90 / 94
4
0
4
68.0
85 / 89
13
1
14
66.7
0
0
61.2
80 / 84
1
26
6
33
64.3
3
0
3
62.8
75 / 79
3
35
19
57
62.1
0
8
2
11
61.9
1
0
1
62.9
70 / 74
17
41
33
91
59.6
2
15
8
26
59.4
1
3
1
4
59.5
65 / 69
30
43
39
112
55.6
12
23
18
53
56.5
2
8
3
13
56.2
60 / 64
37
37
47
121
51.3
15
28
22
65
51.0
6
11
8
26
52.4
55 / 59
44
29
40
113
47.1
23
32
29
84
46.7
8
17
11
36
46.7
50 / 54
46
15
34
95
43.0
31
38
36
105
42.6
12
27
18
58
42.6
45 / 49
36
4
19
59
39.0
39
39
42
119
38.0
27
40
35
102
38.1
40 / 44
23
1
8
33
34.6
44
31
41
117
33.7
42
48
50
140
33.9
35 / 39
9
0
2
11
30.5
40
14
28
82
29.5
52
41
48
140
29.5
30 / 34
2
0
2
25.9
20
5
10
35
25.0
39
23
34
96
24.7
25 / 29
9
2
4
14
20.3
25
12
17
54
20.1
20 / 24
3
1
1
5
15.4
16
7
9
33
15.4
15 / 19
1
0
0
2
10.8
9
6
6
20
10.6
10 / 14
0
0
7.5
4
2
3
10
5.9
5/ 9
3
1
2
6
1.2
0/ 4
2
1
1
3
-3.5
-5 / -1
1
0
1
2
-7.3
-10 / -6
0
0
0
1
-12.0
-15 / -11
-20 / -16
Caution: This summary reflects the typical distribution of temperature in a typical year. It does not reflect
the typical moisture distribution. Because wet bulb temperatures are averaged, this summary understates
the annual moisture load. For accurate moisture load data, see the long-term humidity summary and the
ventilation and infiltration load pages in this manual.
19


 Previous Page
