CEMP-E
TI 809-07
30 November 1998
Table C-2b Values of Fv as a Function of Site Class and Mapped 1 Second
Period Maximum Considered Earthquake Spectral Acceleration5
Site Class
1 Second Period Maximum Considered Response Spectral
Acceleration
S1 ≤ 0.1
S1 ≥ 0.5
S1 = 0.2
S1 = 0.3
S1 = 0.4
A
0.8
0.8
0.8
0.8
0.8
B
1.0
1.0
1.0
1.0
1.0
C
1.7
1.6
1.5
1.4
1.3
D
2.4
2.0
1.8
1.6
1.5
a6
E
3.5
3.2
2.8
2.4
F
a
a
a
a
a
second, SM1 adjusted for site class effects are calculated as follows (FEMA 302, Eq. 4.1.2.4-1 and
4.1.2.4-2):
SMS = Fa S S
(Eq C-1)
and
SM1 = Fv S1
(Eq C-2)
These values define the elastic spectra. These values are reduced to define design earthquake spectral
4.1.2.5-1 and 4.1.2.5-2):
2
SDS =
SMS
(Eq C-3)
3
and
2
SD1 =
SM1
(Eq C-4)
3
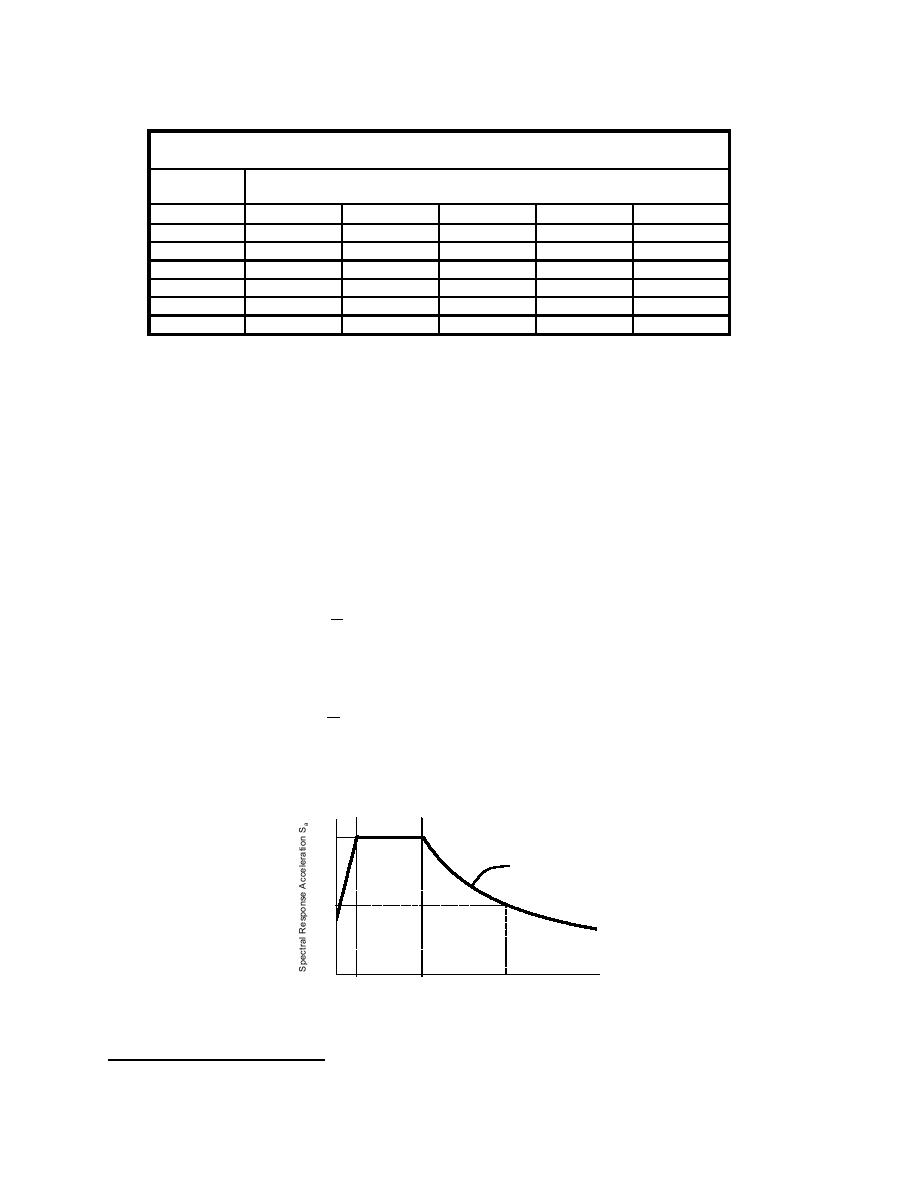
From these terms a design response spectrum is developed as indicated in Figure C-1 (FEMA 302,
Figure 4.1.2.6). For the natural period of the structure, T this spectrum defines values of effective
acceleration. The three regions of this spectrum are defined as follows:
SDS
Sa=SD1/T
SD1
Ts
To
1.0
Period T
Figure C-1. Design response spectrum.
5
6
a indicates that a site-specific geotechnical investigation and dynamic site response analyses shall be performed.
C-2


 Previous Page
