TM 5-820-1/AFM 88-5, Chap 1
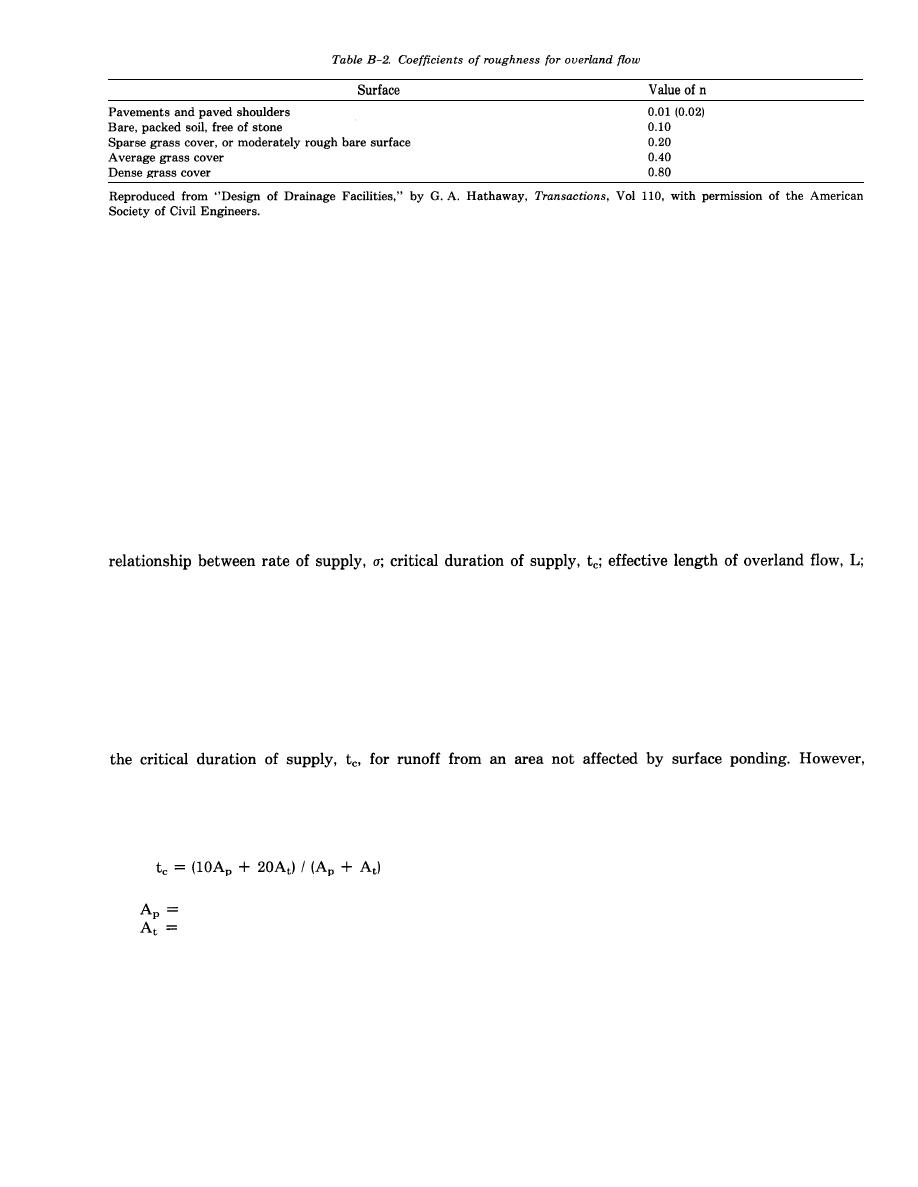
b. Effect of paved area on determination of effective length. Pending areas are frequently located in
intermediate turfed areas bordered by paved runways, taxiways, or aprons. Runoff from paved areas
ultimately passes over turfed slopes to reach the pending areas and drain inlets, and is retarded in a
manner similar to runoff that results from precipitation falling directly on the turfed area. Inasmuch as
the time required for water to flow from the average paved area is normally very short (5 to 10 minutes),
the length of the paved area can be disregarded or given very little weight in estimating the value of L
for a composite area.
c. Determination of effective length for pending conditions. The true value of L applicable to a
particular area varies as the size of the storage pond fluctuates during storm runoff. As water
accumulates in the relatively flat storage area during storm runoff, the size of the pond increases rapidly
and progressively reduces the distance from the edge of the pond to the outer limits of the drainage
area. In the majority of cases, it is satisfactory to estimate the value of L as the distance from the outer
limits of the drainage area to the average limits of the pending area during the period of design-storm
runoff. If the drain inlet is not located near the centroid of the drainage area, the value of L can be
estimated approximately as the average distance to the limit of the pending area, which corresponds to a
depth equal to two-thirds of the maximum depth caused by the design storm.
B-3. Runoff.
a. General. The curves shown in figures 3 (main text) and B-7 through B-14 describe the
and maximum rate of runoff for the various supply curves presented in figure 2. The curves portray the
data presented in the flow curves shown in figure B-2 through B-4 in another format. Table B-3
illustrates the computational procedure. The runoff values obtained are assumed to be the maximum
because surface storage is negligible. Actually, the maximum runoff would normally occur a short time
after the rainfall excess or rate of supply ceases. For practical purposes, however, the maximum rate of
overland flow can be assumed to occur at approximately the same time that the rate of supply ends.
b. Peak runoff rates. Figures 3 and B-7 through B-14 are not hydrography for any specified design
storm, but represent the peak rates of runoff from individual storm events of various durations, all of
which have the same average frequency of occurrence. The duration of supply corresponding to the
greatest discharge for a particular standard supply curve and value of L in these figures is defined as
experience indicates that adopting minimum values for tC of 10 minutes for paved areas and 20 minutes
for turfed areas in the actual design of storm drains is feasible and practical. For combined turfed and
paved areas, minimum values of tC are to be used even though the calculated effective length of overland
flow indicates a shorter critical duration of supply. For combined turfed and paved areas, where only the
minimum values of tC are of concern, the following equation should be used in selecting tC:
(eq B-3)
where
area paved, acres
area turfed, acres
c. Consolidated design curve. The data presented in figures 3 and B-7 through B-14 with respect to
peak runoff rates and critical durations of supply have been consolidated into one diagram, figure B-15.
Use of figure B-15 is not as precise as using figures 3 and B-7 through B-14, but figure B-15 may be
applied to most drainage problems. The following example is provided to illustrate the use of figure
B-15. Assume an effective length of overland flow of 315 feet and a rate of supply of 1.0 inch per hour.
To determine the critical duration of supply, project a line vertically upward from the effective length to
the intersection of the tC curve and proceed horizontally to the right to the critical duration of supply
B-9


 Previous Page
